Energy Sharing and the Grid
Imagine an industrial zone housing two sites: a distribution hub doing last-mile deliveries with exclusively electric vehicles, and a large cold-storage warehouse. Both have a considerable collection of solar panels on their rooftops, but as you might imagine, their power consumption patterns are very different.
Most of the distribution hub’s consumption happens at night, when its fleet of electric vehicles needs recharging. The facility’s energy manager has therefore made the smart decision of installing batteries so they can save some of the PV electricity they generate during the day, and use it at night. The warehouse has relatively steady consumption throughout the day: the largest share of that consumption goes towards powering its freezer section.
The warehouse is large, and generates a huge surplus of solar electricity that it injects back into the grid for an average price of around €0.03 EUR / kWh. The distribution hub is way smaller, and doesn’t actually generate enough electricity during the day to be able to charge their whole fleet at night. So depending on the charge of the battery, they draw additional power from the grid at €0.15 EUR / kWh.
The thoughtful reader may have already noticed that a much better economic outcome could be achieved if the warehouse could share their daytime surplus PV directly with the distribution hub, who could then use it to further charge their batteries and decrease the share of electricity they still need to buy at night.
They could agree to do this at some price (say, a midprice of €0.09). This would be the better deal for both of them: the warehouse can sell their surplus at a 6 cents per kWh premium compared to their injection remuneration, and the distribution hub saves 6 cents per kWh on the share of energy they get from the warehouse.
This concept is called energy sharing, and the two industrial sites may decide to enter into an energy community (EC) to formally make this happen.
Energy Sharing
It’s important to understand that in these energy communities, the physical flow of electricity is unchanged. The distribution system operator (DSO), who is informed of the energy sharing agreement, simply instructs each member’s supplier to deduct the amount of shared energy from the relevant invoice component. In the case I’m describing, there are no physical cables or other behind-the-meter infrastructure installations for sharing electricity, everything goes through the DSO.
In Flanders, where I live, that DSO would be Fluvius. The legal framework was laid in June 2021, and at the start of 2023, Fluvius operationalized the concept of energy communities.
A note on Flemish regulation
According to the VNR (Vlaamse Nutsregulator), energy communities are actually not allowed to sell electricity between members yet, only sharing it free of charge. However, new European legislation from 2024 changes that definition to allow trading within an EC, and it’s expected that Flemish regulation will follow.
Let’s take a closer look at how energy sharing is actually implemented. The injection-consumption matching always happens on a quarter-hour basis, with data read out from the digital meters. One can’t just match energy produced by one member during the day with another member’s consumption during the night, because sharing needs to happen within 15-minute intervals and electricity produced at different moments is not interchangeable.
There is also a mechanism that determines how the produced energy is allocated to participants within a quarter-hour, with Fluvius providing options for fixed, relative or optimal sharing keys. Let’s look at a simple fixed key example: all injected energy during quarter is added up to get the total injected energy . Then, each member is allocated their share of , determined by the configured allocation percentage (and what they actually consume, which is the limit of their allocation). There’s nothing more to it than that. Any leftover surplus is distributed pro-rata across all injectors, and sold back to the supplier as it was before.
Benefits
Some benefits are straightforward to understand: sharing locally generated surplus electricity is advantageous to all parties involved, and allows them to save on the volumetric energy component of their energy bills. Surplus generators get paid more than they would by injecting indiscriminately back into the grid, and consumers potentially get a much better price for locally shared energy.
Additionally, if the energy was produced by local renewables, consumers of that energy can attribute that portion of their energy consumption to green, renewable energy. There is usually no such attribution for electricity consumed from regular suppliers (so-called “grey energy”).
Advanced ECs could even start coordinating and orchestrating their energy consumption & production in order to maximize the welfare of all its participants, by integrating their energy management systems with community-wide software. This would drastically cut down on the ECs total grid consumption (and potentially injection) in terms of volume (kWh), but also in terms of capacity (kVA/kW). We’ll talk about this more below.
Energy Cost Structure
This would be a good moment to highlight that an energy bill is much more than just the kWh’s you have consumed over the month. There are quite a few cost components, the most relevant of which are described in the table below11 The full methodology in Dutch can be found here.:
| Name | Unit | Paid To | Notes |
|---|---|---|---|
| Energy procurement charges | €/kWh | Supplier | Electricity purchased from a supplier. |
| Capacity charges | |||
| - Contracted capacity | €/kVA2 | DSO | Contracted, reserved capacity.2 kVA is a measurement of apparent power, as opposed to real power. Simply put: kVA = kW + loss. For our purposes here the difference can be neglected. |
| - Monthly peak | €/kW | DSO | Peak measured demand in a 15-minute window. |
| Other network costs | €/kWh or fixed | Public-service obligations, surcharges and metering, TSO costs |
Capacity charges can make up quite a large portion of the total bill as well. In fact, a recent study from May 2026 arrives at the following breakdown for a medium-voltage business in Flanders (160MWh/year)33 Page 26 of the study, column VLA 2026.:
| Component | Cost | Share of Total |
|---|---|---|
| Energy procurement | €91/MWh | 50% |
| Network costs | €48/MWh | 26% |
| Other costs and levies | €44/MWh | 24% |
| Total | €183/MWh | 100% |
Capacity charges are embedded in the network costs component. To approximate how much, we can use numbers from the VNR on a standard medium-voltage consumption profile:
- Contracted capacity: 95 kVA
- Average monthly peak: 70 kW
Applying known 2026 network tariffs results in contracted capacity charges of €3,389 and monthly peak charges of €3,234, for a total of €6,623 per year. Dividing this by 160MWh gets us to €41.4/MWh. This represents 22.6% of total yearly costs, nearly 1/4. Extra charges apply if capacity is exceeded.
Because this is a non-trivial cost, most consumers will try to actively reduce these charges. Peak shaving is a strategy employed by consumers today that attempts to flatten spikes in electricity demand, thereby reducing capacity charges. This requires a lot of observability and some form of smart energy management, and in practice can look like attempting to curtail peaks by matching local production with consumption, or spreading out concentrated consumption patterns (i.e. not charging all EVs at once).
The reason I’m zooming in on the capacity charges will become clear later, but first, we need to look at the impact of energy sharing on the wider grid.
Grid Impact
Earlier, I brought attention to the fact that energy sharing is a purely virtual settlement mechanism. This is true, but it deserves a little more nuance around locality, or where and how the energy community is connected to the grid. This is important as it relates to grid congestion, a problem that’s very widespread since the exponential electrification of industry and households.44 In fact, Fluvius reported about 800 companies waiting to get connected in Flanders in April 2026. Their response has been to introduce flexibility: some companies can get connected with reserved capacity, but may at any moment be required to tone down their consumption in case of congestion. This is obviously not suitable for all business activities.
Let’s take a look at the physical grid layout around a medium-voltage distribution ring:
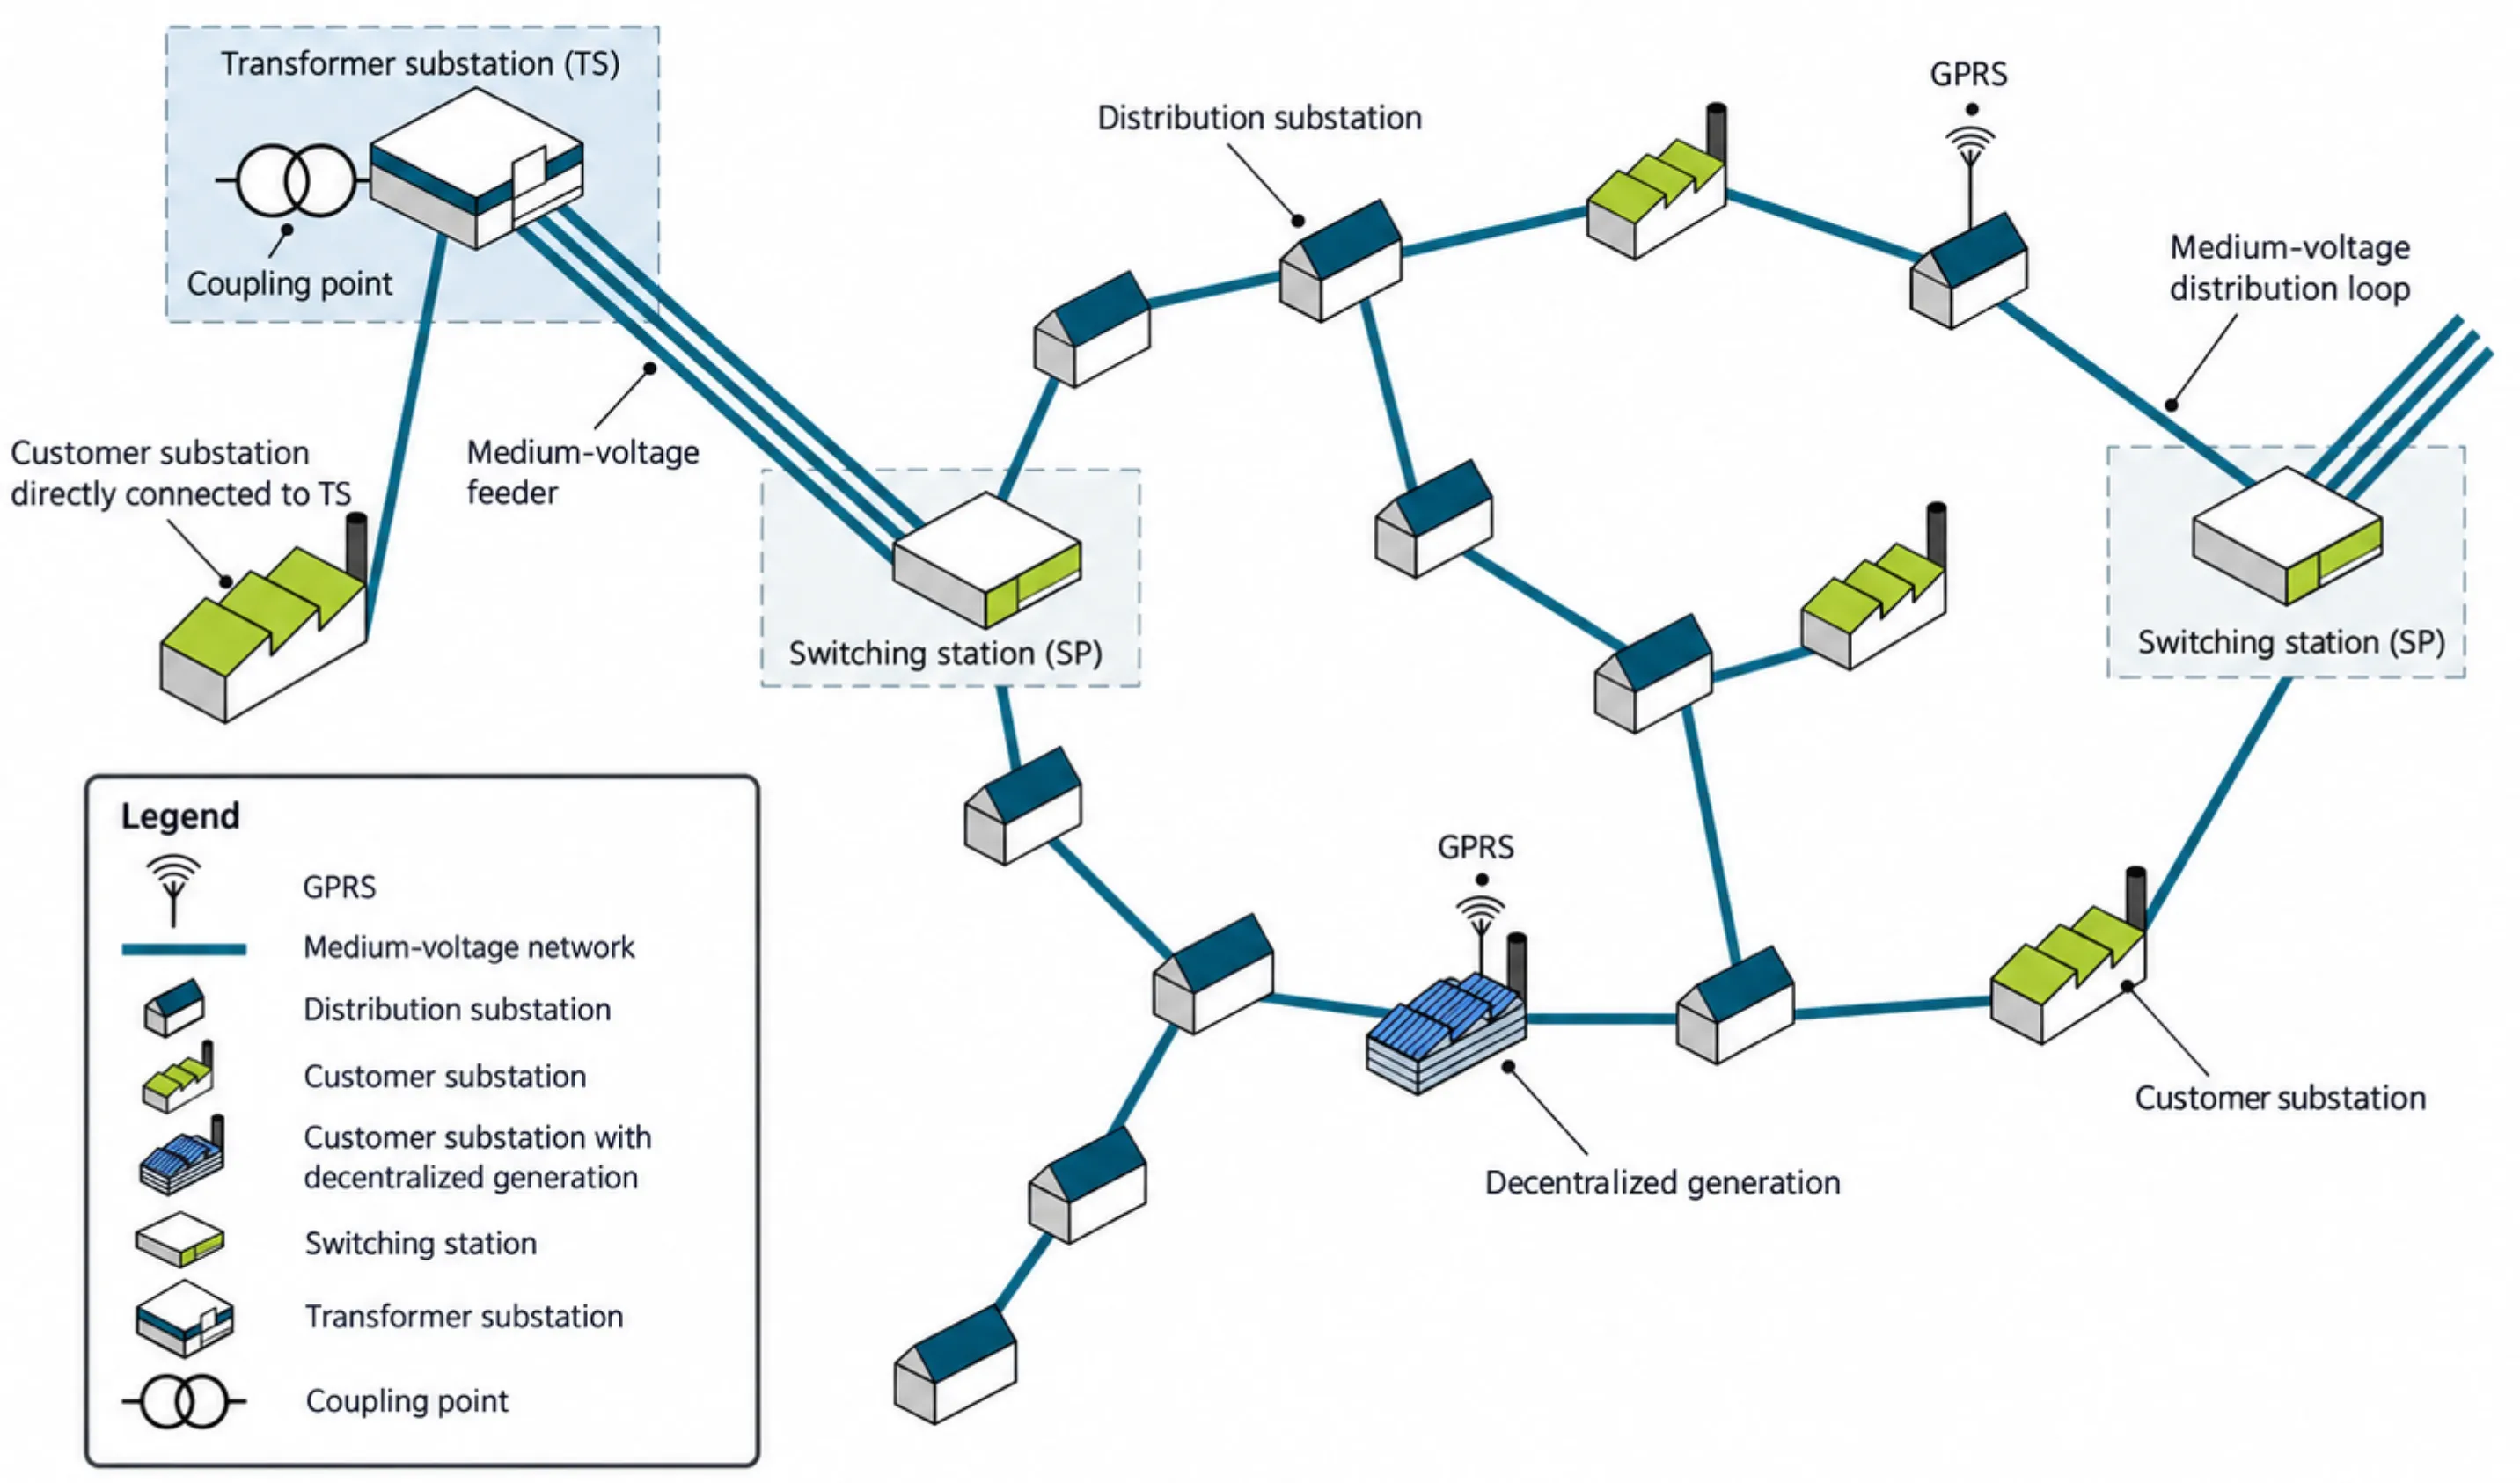
Congestion in Flanders is expected to occur at various upstream elements in the network hierarchy, mostly upstream of the actual distribution ring. Fluvius identifies the transformer substations as the most crucial bottleneck right now.55 Fluvius Investeringsplan 2026-2035, page 84. Elia’s high-voltage transmission lines are also flagged as potential bottlenecks in some regions. These substations connect the upstream Elia high-voltage network to Fluvius’ medium-voltage network:
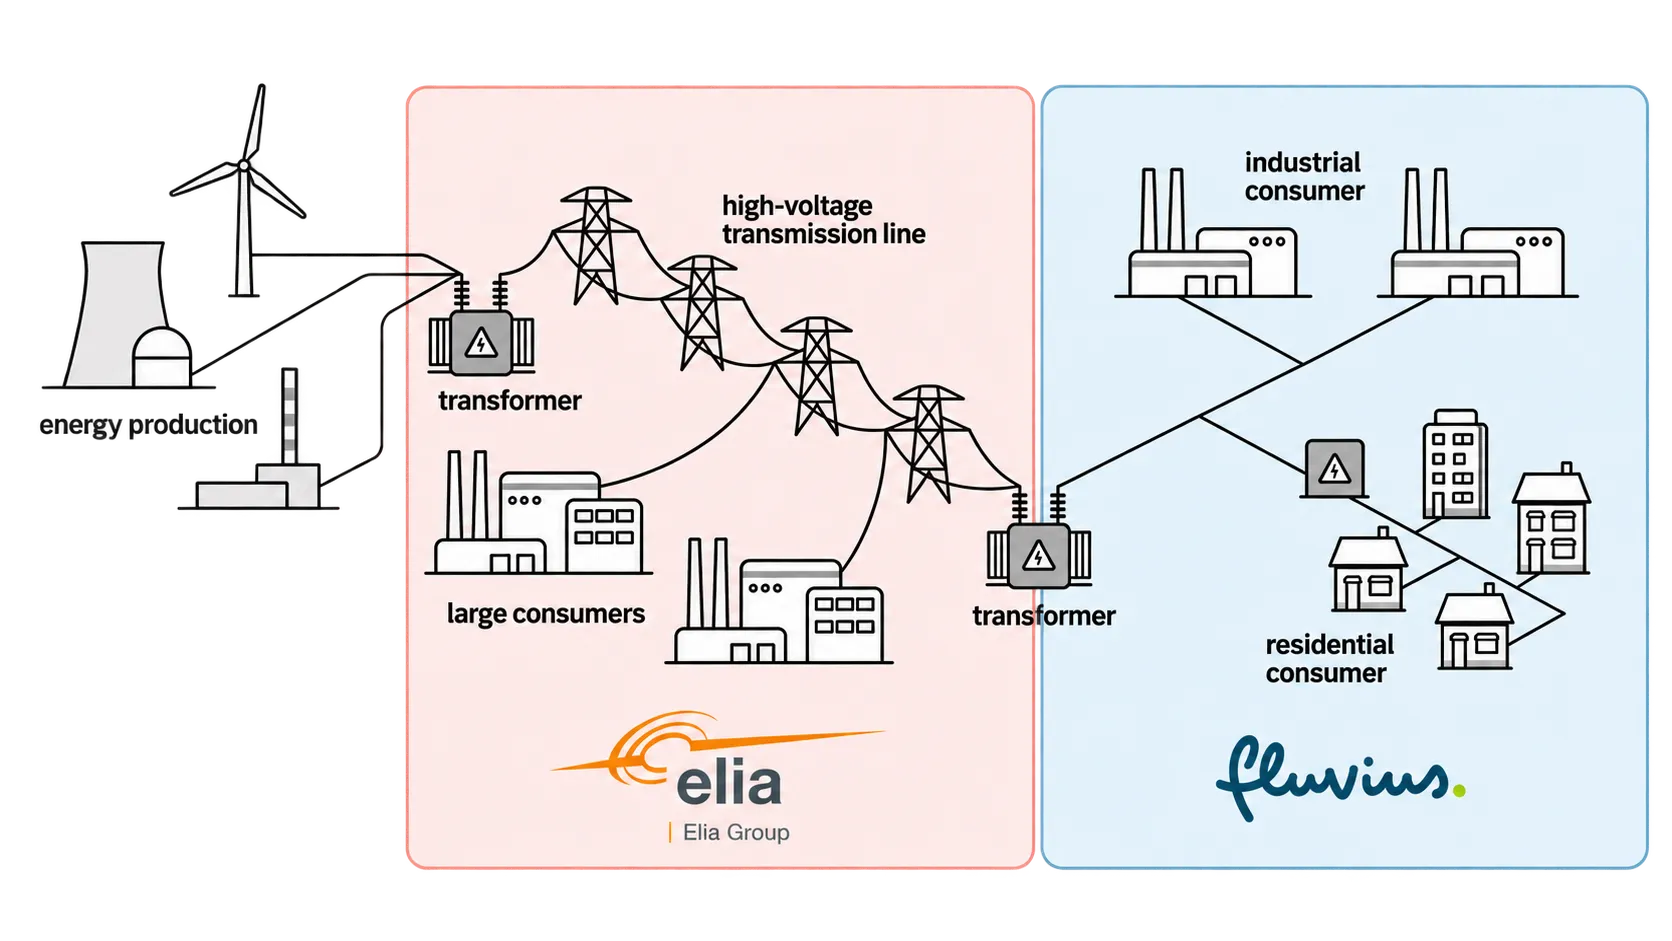
Most of these substations consist of redundant transformers to prevent downtime, but it’s not uncommon to have substations where most transformers are already in use (including backups), and where some consumers are not guaranteed year-round reliable power (in case of transformer maintenance or other issues).
Note that transformers work in two directions: consumption and injection. Both directions are limited in peak capacity, and in both cases these limits are starting to be reached.
This is where I want to tie it back to energy communities and capacity charges. Every additional Watt that’s matched within a local energy community (behind the same transformer, on the same MV ring, see figure 1), is a Watt that doesn’t congest the upstream grid elements. If energy communities can be further incentivized to match injection and consumption relative to their current baseline through effective coordination and smart systems, they can potentially reduce substation-level congestion!
Incentivizing Grid Relief at the EC Level
Capacity charges are an aggregate economic signal that’s meant to reflect the strain individual consumers (or producers) put on the grid, and is measured at the meter endpoint. Individual consumers are rewarded for reducing their own peaks, but not necessarily for reducing their contribution to congestion at shared upstream infrastructure.
An energy community is a perfect framework for coordinating grid relief, because of the shared observability: ECs already benefit economically by matching local generation and consumption, and advanced ECs can shave their collective peaks to decrease load on the upstream grid, there just aren’t any incentives to do so.
-
kVA is a measurement of apparent power, as opposed to real power. Simply put: kVA = kW + loss. For our purposes here the difference can be neglected. ↩
-
In fact, Fluvius reported about 800 companies waiting to get connected in Flanders in April 2026. Their response has been to introduce flexibility: some companies can get connected with reserved capacity, but may at any moment be required to tone down their consumption in case of congestion. This is obviously not suitable for all business activities. ↩
-
Fluvius Investeringsplan 2026-2035, page 84. Elia’s high-voltage transmission lines are also flagged as potential bottlenecks in some regions. ↩